
GA4 Metrics You Should Be Monitoring
While the latest version of Google Analytics (GA4) shares many similarities with its predecessor, Universal Analytics (UA), certain changes have caused some confusion.

Changes to the way events are tracked and changes to the user interface itself have made many marketers wonder which metrics are most important now for analyzing the success of their marketing efforts and website. This guide details what has changed, what matters most, and how to view these metrics.
Universal Analytics (UA) to Google Analytics 4 (GA4): Differences in Metrics
When Google switched over its analytics platform, it also changed some ways that events and metrics are tracked. While UA data was based on pageviews and sessions, GA4 uses user actions like events and their parameters to track data. This allows you to collect data from anything you like—you’re no longer beholden to Google’s predefined options for tracking. When comparing data between the two, knowing how and why they are calculated differently is essential to your reporting. Let’s look at users, pageviews, sessions, key events/conversions, and bounce rate.
Users
Within Universal Analytics, the primary user metric was counted as total users, but in GA4 the primary user metric is counted as active users. While GA4 does track total and new users, the default is active users. An active user, in GA4, is defined as “any user who has an engaged session or when Analytics collects the first_visit event or engagement_time_msec parameter from a website.” In other words, active users are any new visitors to your website or visitors who signal engagement by staying on your page for more than 10 seconds, having more than one pageview, or making at least one conversion.
Because of the difference in the primary metric for users between UA and GA4, you cannot compare the two directly hoping for similar outcomes. Your UA main number for users was probably higher than your GA4 main number for users, as GA4 does not default to show all users. Instead, in GA4 you’re seeing a better indicator of users who have actually interacted with your website in an engaged manner.
Pageviews
Pageviews between the two platforms have remained fairly similar. In UA, pageviews were tracked by the total number of pages viewed. Similarly in GA4 (although now simply called views), they are calculated as the number of app screens and/or web pages your users saw. Where you may see differences: filters you might have applied in UA are no longer available in GA4. For example, in UA you could filter out geographic regions from your entire account, but in GA4 you cannot, which makes it appear there are more pageviews within GA4. In fact, GA4 does not currently support any filters for its platform. Keep in mind this change if you see high disparities in your data.
Sessions
Sessions between the two platforms will again be somewhat similar. In both UA and GA4, a session will end after a 30-minute period of inactivity, depending on the session timeout settings. However, in UA sessions the timestamp was cut off at midnight, based on the time zone in which the view was set up, and a new session was considered to have started after that reset. In GA4, if a user is on the website at midnight, it will not be counted as a separate session. Of course, most B2B traffic doesn’t happen at midnight, but this is a difference to be aware of nonetheless. Another difference to note: in UA, if a user picked up new campaign parameters while on the website, this counted as a new session, but that is not the case for GA4.
Key Events/Conversions
Within Universal Analytics, conversions were based on goals that you created around a particular user action, such as filling out a form. Each goal was counted only once per session. However, in GA4, we use conversion events to define specific conversion actions on the website. Now, GA4 counts each instance of the conversion event within a session by default. If a user submits a particular form twice during their session, that will be counted as two key events/conversions in GA4, whereas in UA, that was counted as only one conversion. With GA4, you are now getting more accurate conversion totals, but multiple submissions or key events/conversions by the same user may be of lesser quality. To mitigate this quality issue and report on more similar numbers, you can update your GA4 conversion counting method setting to “once per session.”
Bounce Rate
In UA, bounce rate was defined as the percentage of single-page sessions in which there was no interaction with the page beyond loading it. A bounced session had a duration of 0 seconds. Within GA4, it is now defined as the percentage of sessions that were not engaged sessions. If a user visits your website, reviews content on your homepage for less than 10 seconds, and then leaves without triggering any events or visiting any other pages or screens, then the session will count as a bounce. This could mean that since the conversion to GA4 you’ve seen an increase in bounce rates on your website. Knowing the way this is measured makes it even more important to make sure your website content and pages are engaging enough for users. That being said, Google has moved away from including bounce rate automatically in reporting and now relies much more heavily on engagement rate as a measurement of user engagement.
Important Metrics to Track in GA4
Knowing the differences and discrepancies within data between the two platforms is important. Even more important, however, is knowing which metrics are most critical for reporting. Understanding how users interact with your site and where to look for any possible pain points can help inform your marketing strategy moving forward. Let’s look at key events/conversions, sessions, new users, views, engagement rate, and average engagement time.
Key Events/ Conversions
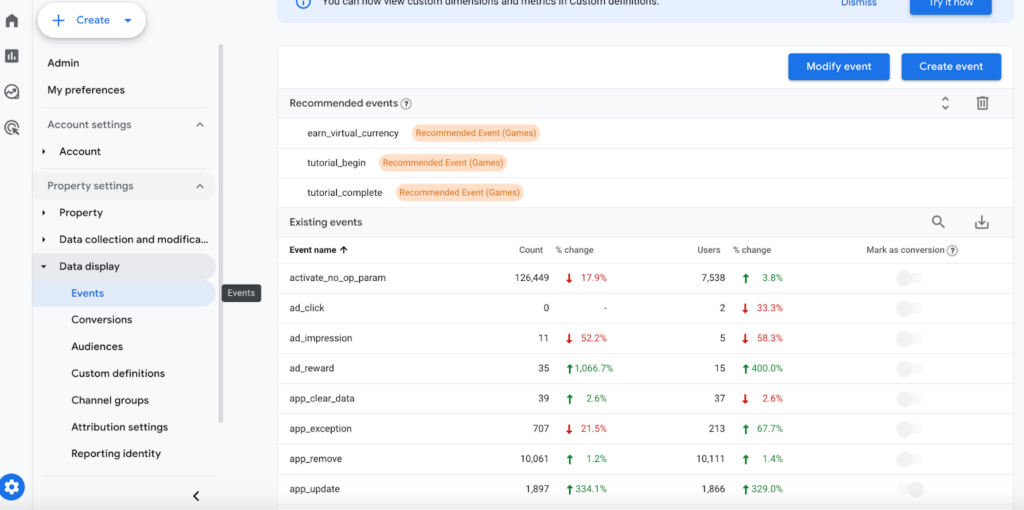
One of the single most important metrics to track is kay events/conversions. Conversion/Key events should be important actions that can be taken on your website, such as contact form submissions, request quote form submissions, newsletter sign-ups, phone calls, and purchases. Actions like these are important to your business and can generally turn into revenue for your company. To track conversion events, you will have to first create events, either within GA4’s admin panel or through GTM. Once the events are created, you then mark them as conversions within Admin -> Data display -> Events.
Once you have your actions marked as conversions, you can then navigate to Reports -> Life Cycle -> Engagement -> Conversions. This report will break down counts for each conversion action.
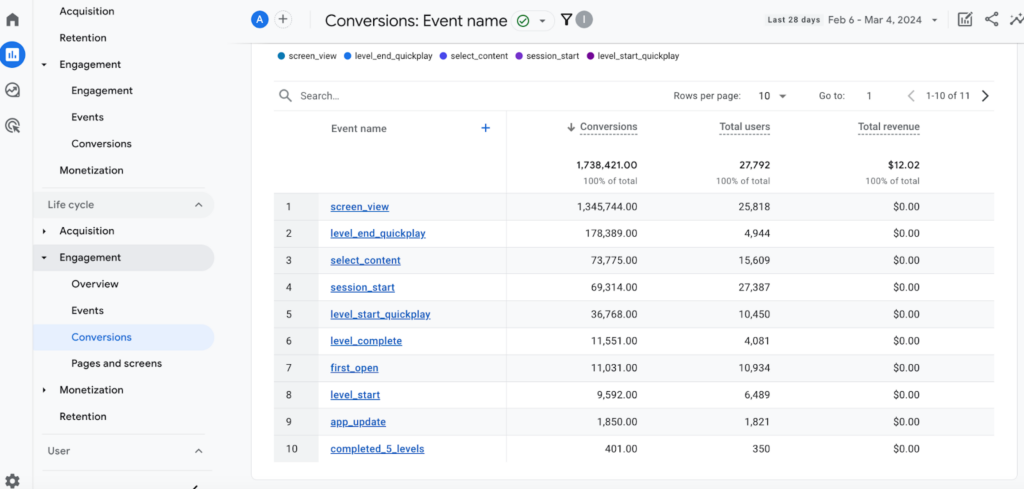
You can click into each conversion action for further detail or add secondary dimensions, such as channel grouping, to see which sources your conversion events are coming from.
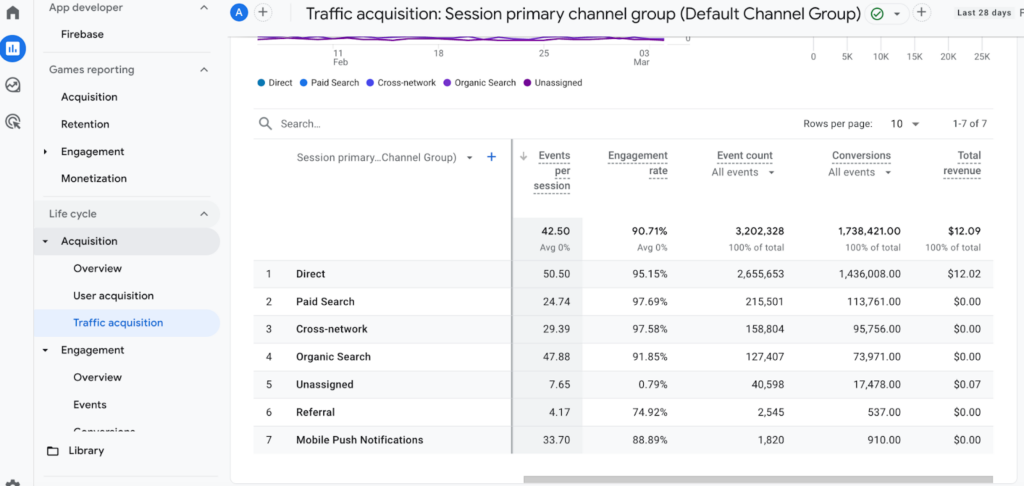
Sessions
Session data is incredibly important to understand how much traffic your website is generating and which sources that traffic is coming from. To find this metric, navigate to Reports -> Life Cycle -> Acquisition -> Traffic acquisition.
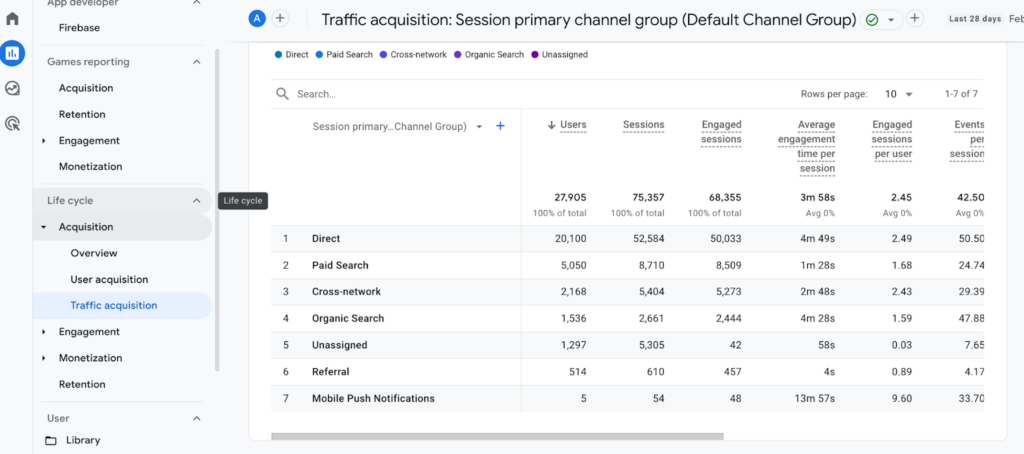
By default, sessions are scoped by session primary channel grouping— in other words, the channel group from which the session started, such as direct, paid search, or organic search. To track more granular campaign data, you can change out the main dimension to source, source/medium, campaign, medium, etc., and add a multitude of secondary dimensions to dig deeper into your traffic analysis.
New Users
“New users” displays the number of users who interacted with your website for the first time. When running prospecting or paid campaigns, this metric is especially helpful in seeing whether your efforts are reaching new users or users who have visited your website previously. To find this metric, navigate to Reports -> Life Cycle -> Acquisition -> User acquisition.
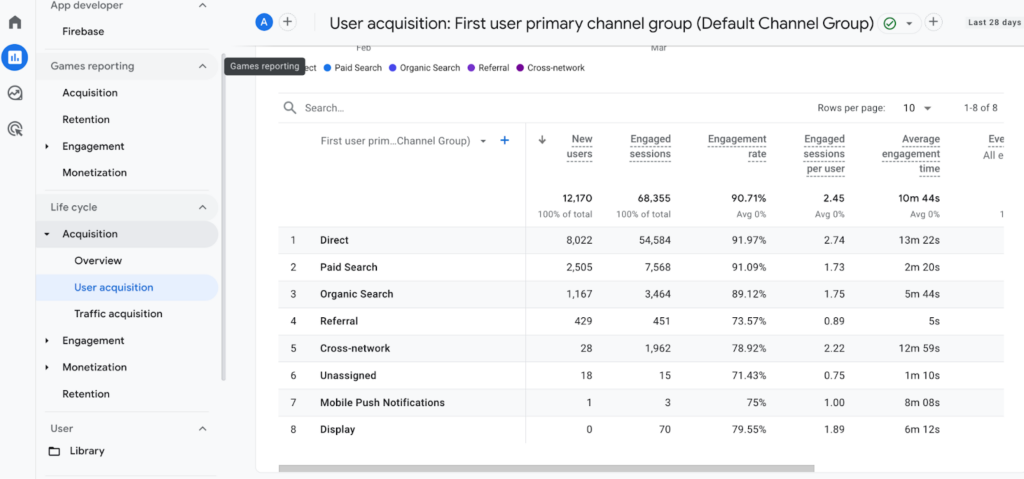
By default, new users are broken down by the first user channel grouping. Just as with sessions, the primary dimension can be changed and secondary dimensions can be added to get a better look at just where these new users came from.
Views
This metric shows how many times users have viewed specific pages on your site. Sorting by views will give you an idea of which pages on your website are most popular and which are least popular. To find this metric, navigate to Reports -> Life Cycle -> Engagement -> Pages and screens.
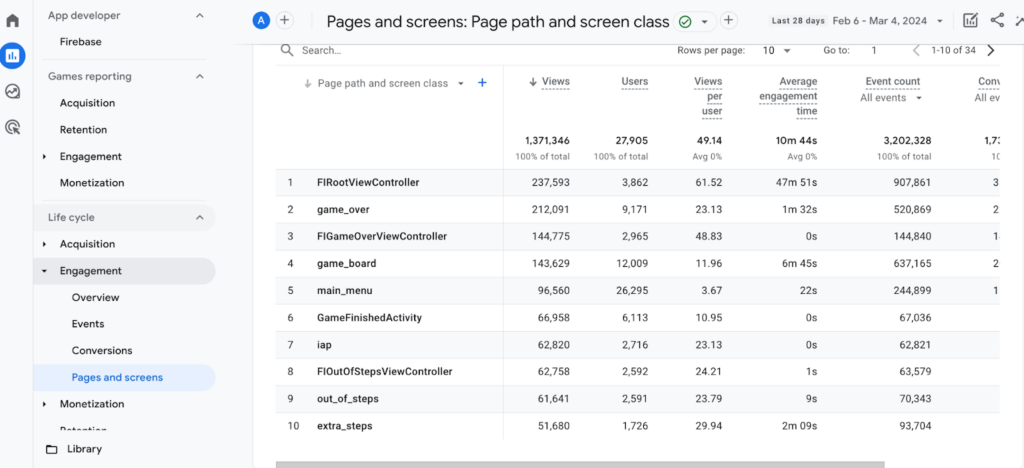
Views are automatically parsed out by page path, but can be switched to page title, if that is preferred as the primary dimension. Secondary dimensions such as traffic source, geography, and platform can be added for further analysis.
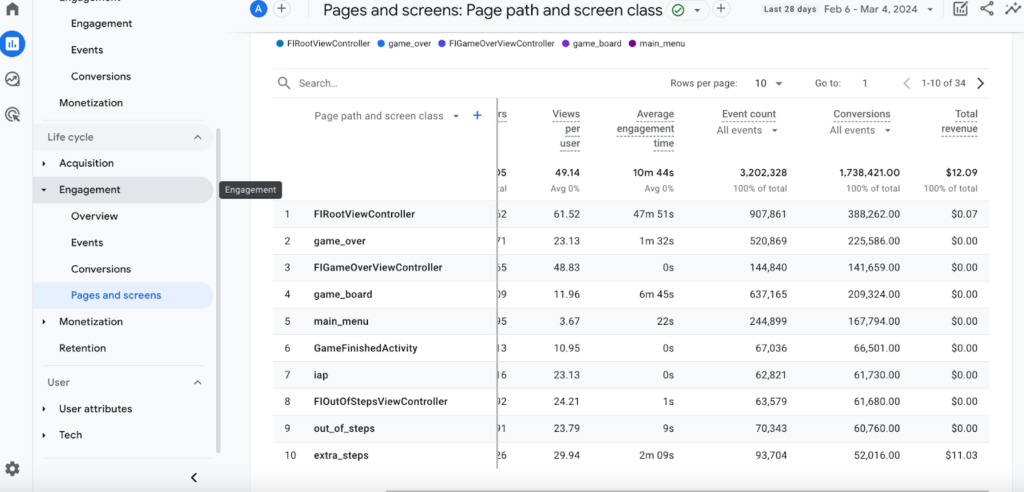
Engagement Rate
Engagement rate tracks the number of engaged sessions divided by total sessions. Engaged sessions are counted when the session lasts longer than 10 seconds, results in one or more conversion events, or results in two or more page/screen views. Engagement rate is important to understand how frequently users are engaging with the website. Sorting by engagement rate can signal which sources are delivering the most engaged traffic and what areas might need improvement to increase overall user interest in your site. To find this metric, navigate to Reports -> Life Cycle -> Acquisition -> Traffic acquisition. Engagement rate will be farther to the right on the default table.
Average Engagement Time
This metric shows the average length of time that your website was in focus in a user’s browser. Tracking average engagement time can help gauge which pages are engaging for users and which pages may need a content update or refresh. Pages with low average engagement time signal low user-friendliness; this metric can provide you with a list of pages that need attention, which is especially important if these pages include your core product or service content. To find this metric, navigate to Reports -> Life Cycle -> Engagement -> Pages and screens. Average engagement time will be farther to the right on the default table.
Conclusion
Your website and marketing strategies are vital to your business’s success, and being able to report on these successes and areas of improvement is just as crucial. Navigating GA4 and its new definitions for metrics and new interface can be confusing. Learning how to understand the nuances of metrics in GA4, where to find them, and which ones are most important will help you build a thoughtful, data-driven strategy around your website and marketing efforts and pave the way to success.
GA4 Data Integrity Audits & Consultation Services
Many marketers are struggling with navigating GA4 (Google Analytics 4) and missing the simplicity of UA (Universal Analytics). We’ve developed a GA4 program that helps you get a better understanding of the platform overall, how to access the data that is most important to you through customized explorations that will decrease time and confusion in the platform.